ROI Calculator
Calculate your Return on Investment (ROI) to assess profitability and efficiency. Compare different investment options, analyze potential returns, and make informed financial decisions with confidence.
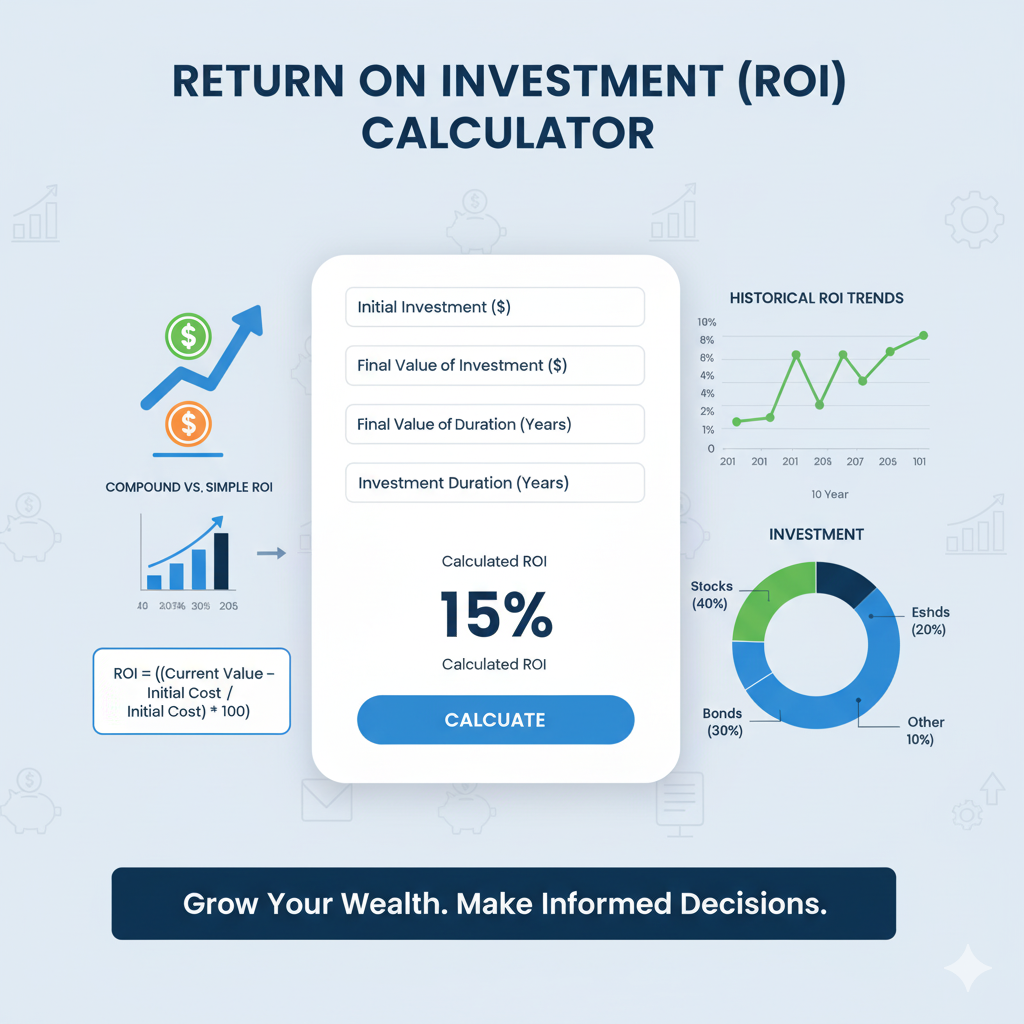
Calculate Your ROI
How to Use the ROI Calculator
Enter your Initial Investment amount - the total money you invested initially.
Input the Final Value - the current or final value of your investment.
Add any Additional Costs like fees, taxes, or transaction costs.
Specify the Time Period in years for annualized ROI calculation.
Complete Guide to Return on Investment (ROI)
Return on Investment (ROI) is the cornerstone metric for evaluating investment performance across all asset classes. Whether you're a seasoned investor or just starting your financial journey, understanding ROI is crucial for making informed investment decisions and building long-term wealth.
ROI provides a standardized way to measure and compare the profitability of different investments, from stocks and bonds to real estate and business ventures. It answers the fundamental question: "How much money did I make (or lose) relative to what I invested?"
Why ROI Matters
ROI is essential because it normalizes returns across different investment amounts and types, enabling you to compare a $1,000 stock investment with a $100,000 real estate purchase on equal footing.
How ROI Works
The Basic Concept
ROI compares what you gained (or lost) from an investment to what you originally invested. It answers the fundamental question: "For every dollar I invested, how much did I gain or lose?"
Example: If you invest $1,000 and it grows to $1,200, your ROI is 20% because you gained $200 on your $1,000 investment.
Why ROI Matters
- •Compare different investment opportunities
- •Evaluate the efficiency of your investments
- •Make data-driven financial decisions
- •Track investment performance over time
- •Justify investment choices to stakeholders
ROI Formulas and Calculations
1 Basic ROI Formula
ROI = (Final Value - Initial Investment - Additional Costs) / (Initial Investment + Additional Costs) × 100
Current market value plus all income received (dividends, interest, rent)
Original purchase price or capital invested
All fees, taxes, commissions, and maintenance costs
2 Annualized ROI Formula
Annualized ROI = [(Final Value / Total Investment)^(1/Years)] - 1 × 100
This formula accounts for the time factor, allowing you to compare investments held for different periods. It shows the compound annual growth rate (CAGR).
3 Step-by-Step Calculation Example
📊 Investment Scenario
🧮 Calculations
Alternative ROI Calculation Methods
Simple Gain/Loss Method
ROI = (Gain - Cost) / Cost × 100
Best for: Quick calculations when costs are minimal
Net Present Value Method
ROI = (NPV / Initial Investment) × 100
Best for: Complex investments with multiple cash flows
Types of ROI Calculations
Simple ROI
Basic calculation without considering time. Best for short-term investments or quick comparisons.
Annualized ROI
Accounts for time factor. Essential for comparing investments with different holding periods.
Risk-Adjusted ROI
Considers the risk level of the investment. Higher-risk investments should generate higher returns.
ROI Benchmarks by Investment Type
Understanding typical ROI ranges helps you evaluate whether your investments are performing well relative to market standards. These benchmarks are based on historical data and can vary significantly based on market conditions, economic cycles, and individual circumstances.
| Investment Type | Typical Annual ROI | Risk Level | Time Horizon | Liquidity |
|---|---|---|---|---|
| 💰 Savings Account | 0.5% - 2% | Very Low | Any | High |
| 🏛️ Government Bonds | 2% - 4% | Low | 1-30 years | Medium |
| 🏢 Corporate Bonds | 3% - 6% | Low-Medium | 1-10 years | Medium |
| 📈 Stock Market (S&P 500) | 7% - 10% | Medium-High | 5+ years | High |
| 🏠 Real Estate | 8% - 12% | Medium | 5-10 years | Low |
| 💎 REITs | 6% - 10% | Medium | 3-5 years | High |
| 🚀 Small Business | 15% - 30% | High | 3-7 years | Very Low |
| ⚡ Cryptocurrency | -50% to +200% | Very High | 1-5 years | High |
⚠️ Important Disclaimers
- • Past performance doesn't guarantee future results
- • ROI ranges are based on historical averages
- • Individual results may vary significantly
- • Consider inflation impact on real returns
💡 Pro Tips
- • Diversify across multiple investment types
- • Match investments to your risk tolerance
- • Consider tax implications on returns
- • Review and rebalance regularly
Advanced ROI Concepts
📊 Risk-Adjusted ROI
Considers the risk level of investments to provide a more accurate comparison.
Higher Sharpe ratio indicates better risk-adjusted returns.
💰 Real vs Nominal ROI
Nominal ROI doesn't account for inflation; real ROI does.
Real ROI shows your actual purchasing power gain.
ROI vs Other Investment Metrics
ROI vs IRR
IRR considers timing of cash flows, ROI doesn't
Use IRR for: Complex investments with multiple cash flows
ROI vs NPV
NPV shows absolute dollar value, ROI shows percentage
Use NPV for: Comparing investments of different sizes
ROI vs ROIC
ROIC focuses on invested capital efficiency
Use ROIC for: Evaluating business performance
ROI Limitations and Best Practices
⚠️ Key Limitations
Risk Blindness
ROI doesn't differentiate between low-risk and high-risk investments with similar returns.
Time Value Ignorance
Basic ROI doesn't account for when returns are received during the investment period.
Manipulation Potential
ROI can be artificially inflated by choosing favorable start/end dates.
✅ Best Practices
Use Multiple Metrics
Combine ROI with Sharpe ratio, IRR, and other metrics for comprehensive analysis.
Include All Costs
Account for taxes, fees, opportunity costs, and inflation in your calculations.
Consider Time Horizons
Use annualized ROI for long-term investments and compare similar time periods.
Practical ROI Applications
📈 Portfolio Management
- • Track individual asset performance
- • Rebalance based on ROI analysis
- • Identify underperforming investments
- • Set performance benchmarks
🏢 Business Decisions
- • Evaluate marketing campaigns
- • Assess equipment purchases
- • Compare expansion opportunities
- • Justify capital expenditures
🎯 Personal Finance
- • Compare investment options
- • Evaluate education costs
- • Assess home improvements
- • Plan retirement strategies